|
|
|
| Table of Contents | ECSS | Model Page |
| Background Information | Background Information | |
| Radiation damage to solar cells | ||
This page is based on the Jet Propulsion Solar Cell Radiation Handbook, Third Edition [Tada et al., 1982].
The major types of radiation damage phenomena in solids which are of interest to the solar array designer are ionisation and atomic displacement. It is important to classify an effect into one of these two categories, if possible, because the general behaviour of each phenomenon has been characterised to a large extent.
Through the use of the concept of absorbed dose, various radiation exposures
can be reduced to absorbed dose units which reflect the degree of ionisation
damage in the material of interest. This concept can be applied to electron,
gamma, and X-ray radiation of all energies. For electrons, the absorbed dose
may be computed from the incident fluence Phi (in cm-2)
as:
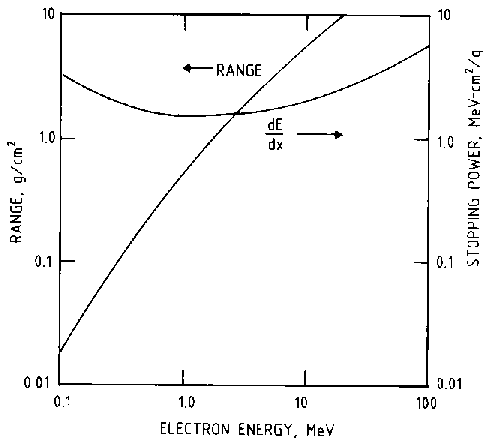
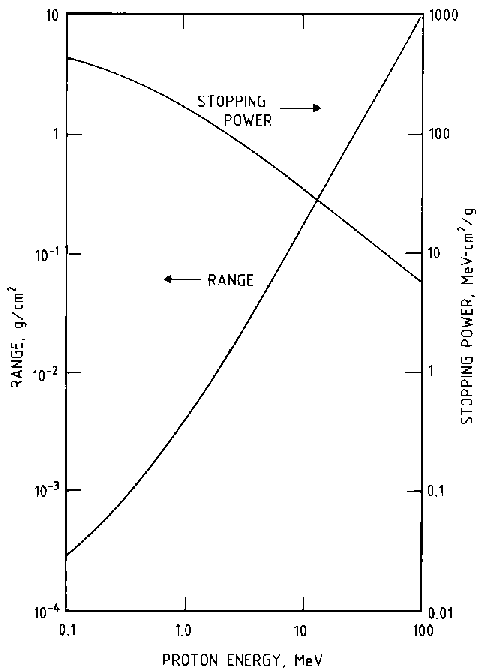
The variations of stopping power and range for electrons and protons of vairous energies can be seen in Figs. 1 and 2. The data presented are for silicon and have been normalised for density. The stopping power and range of a fast particle are not strong functions of the atomic number of the absorber material. For this reason, the data in Figs. 1 and 2 can be used for materials with a similar atomic number with a negligible error.
|
|
|
|
|
|
|
Radiation may affect solar cell array materials by several ionisation related effects. The reduction of transmittance in solar cell cover glasses is an important effect of ionising radiation. The darkening is caused by the formation of colour centres in glass or oxide materials. The colour centres form when ionising radiation excites an orbital electron to the conduction band. These electrons become trapped by impurity atoms in the oxide to form charged defect complexes which can be relatively stable at room temperature.
Radiation produces many ionisation related effects in organic materials. These changes all result from the production of ions, free electrons, and free radicals. As a result of these actions, transparent polymers ae darkened and crosslinking between main-chain members may drastically alter the mechanical properties.
The use of silicon dioxide as a surface passivation coating and dielectric material in silicon devices results in a wide range of ionisation related radiation effects. The development of trapped charges in the silicon dioxides can cause increased leakage currents, decreased gain, and surface channel development in bipolar transistors and increased threshold voltages in MOS field effect transistors (MOSFETs). Ionising radiation in silicon excites the electrons of the valence band to the conduction band, creating electron-hole pairs in much the same way that carrier pairs are generated by visible light. Although an optical photon of energy equal to or greater than 1.1 eV will create an electron-hole pair, roughly three times this amount of energy must be absorbed from a high energy particle to produce the same carriers.
The displacement of an atom from a lattice site requires a certain minimum energy similar to that of other atomic movements. The energy of sublimation for a silicon atom is 4.9 eV. The energy for the formation of a vacancy in the silicon lattice is 2.3 eV. The displacement of an atom involves the formation of a vacancy, the formation of an interstitial atom and other electronic and phonon losses. It is reasonable to expect that the energy of displacement is several times larger than the energy of formation for a vacancy. Seitz and Koehler [1956] have estimated that the displacement energy is roughly four times the sublimation energy. Electron threshold energies of 145 keV and 125 keV have been reported, with corresponding displacement energies of 12.9 eV and 11.0 eV, respectively. These displacement energies correspond to proton or neutron thresholds of 97.5 eV or 82.5 eV, respectively, in silicon. Since particles below the threshold energies cannot produce displacement damage, the space environment energy spectra are effectively cut off below these values.
For particles above the threshold energy, the probability of an atomic
displacement can be described in terms of a displacement cross section. Using
this concept, the number of displacements can be estimated as:
The direct result of the radiation is the production of vacant lattice sites (vacancies) and silicon atoms which come to rest in the interstices of the crystal lattice (interstitials). The distribution of vacancies will not be uniform, because the vacancies from secondary displacements will lie relatively close to the associated primary vacancy.
| Electron Energy (MeV) |
sigma (10-24 cm2) |
nu |
sigma nu (10-24 cm2) |
na sigma nu (cm-1) |
|---|---|---|---|---|
| 1 | 68 | 1.53 | 104 | 5.2 |
| 2 | 73 | 2.00 | 146 | 7.3 |
| 5 | 77 | 2.76 | 212 | 10.6 |
| 10 | 77 | 3.39 | 261 | 13.0 |
| 20 | 77 | 4.09 | 314 | 15.7 |
| 40 | 77 | 4.74 | 363 | 18.2 |
Kinchin and Pease [1955] give the following relationship for the average total
number of displaced atoms produced for every primary knock-on including the
primary knock-on:
In addition to the displacement rates discussed above, Kinchin and Pease [1955]
have computed the total number of displacements Ntd(E)
a projectile will produce in a material as it enters with energy E and
comes to rest in the material. For the specific case of protons in silicon
their formula reduces to:
One of the most commonly used analytical tools for the determination of the
particle type and energy dependence of degradation in silicon solar cells has
been developed from the the basic relationship for lifetime
degradation:
The minority carrier lifetime or diffusion length in an irradiated solar cell may be a function of the concentration of excess or non-equilibrium minority carriers present in the semiconductor. In solar cells, this behaviour is referred to as injection level dependence. This behaviour is usually associated with solar cells damaged by high energy protons or neutrons.
It is also possible to characterise solar cell damage in
terms of the changes in the minority carrier diffusion length. Since the
diffusion length can be measured experimentally and is a measure of the amount
of displacement damage in the base of the solar cell, this method has been
widely used. There are several practical and fundamental limitations to this
scheme. The most serious limitations involve the evaluation of low energy
proton damage in terms of diffusion length. Very low energy protons do
considerable displacement damage within the junction space charge region of a
solar cell. This nonuniform damage increases the diode saturation current
(I0) and quality factor (n) by mechanisms which are
not related to minority carrier diffusion. This damage can cause serious
reduction in solar cell Voc without changing the cell
diffusion length. In addition, the relation between diffusion length and the
solar cell output parameters is not well defined, diffusion length is more
difficult to measure than cell output parameters (particularly in the case of
proton irradiated cells), and accurate measurement of diffusion length of thin
or drift field cells is extremely difficult. Because of these problems, methods
have been evolved to evaluate solar cell radiation effects in terms of common
engineering output parameters. Experience has shown that the variation of
common solar cell output parameters during irradiation can be described as
shown for Isc in the following case:
The variation of solar cell Voc during irradiation may also
be empirically characterised by an expression similar to the
first equation for Isc:
The maximum power of a solar cell can be represented as the product of
Isc, Voc, and a constant:
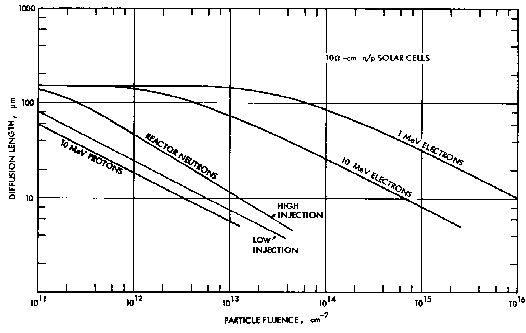 |
| Figure 3. Variation of solar cell diffusion length with fluence for various radiations |
The concept of damage equivalence can alternatively be based on common solar cell parameters. The variation of short circuit current density for 10 ohm-cm n/P solar cells irradiated in various environments is shown in Fig. 4. The Isc variation in each environment is described by the equation for Isc. In this case, two constants, C and Phix, are required to describe the changes in Isc. Experience has shown that the constant C, under solar illumination, does not vary greatly for different radiation environments. For electron irradiations in the 1 MeV and greater range, C is approximately 4.5 to 5.5 mA cm-2-decade. For proton and neutron irradiations, C approaches 6 to 7 mA cm-2 decade-1. For solar cells with the same starting Isc, the constant Phix is a measure of the damage effectiveness of different radiation environments. The constant Phix for a particular radiation can be determined graphically on a semi-log plot at the intersection of the starting Isc and the extrapolation of the linear degradation region.
![[Variation of solar cell short circuit current]](varsccd.gif) |
| Figure 4. Variation of solar cell short circuit current density with fluence for various radiations |
Since the value of Phix is dependent upon the starting Isc, it is not a good practical measure for relative damage effectiveness. It has been the practice to define an arbitrary constant referred to as the critical fluence Phic. One method of defining this value is that fluence which degrades a solar cell parameter 25% below its unirradiated state. Such a parameter is valid only when comparing cells with similar initial parameters. To eliminate this problem, critical fluence may be defined alternatively as that fluence which will degrade a cell parameter to a certain value.
By use of the critical fluence or the diffusion length damage coefficient, it is possible to construct a model in which the various components of a combined radiation environment can be described in terms of a damage equivalent fluence of a selected mono-energetic particle. 1 MeV Electrons are a common and significant component of space radiation and can be produced conveniently in a test environment. For this reason, 1 MeV electron fluence has been used as a basis of the damage equivalent fluences which describe silicon solar cell degradation.
The use of the damage equivalent fluence scheme involves two separate problems. The first problem is to adequately describe the degradation of an unshielded silicon solar cell under 1 MeV electron irradiation under laboratory conditions, i.e. normal incidence. The second problem is to reduce the effect of the space radiation environment (i.e. continuous energy spectra of electrons and protons, isotropic incidence) on a shielded silicon solar cell to a damage equivalent fluence of 1 MeV electrons under laboratory conditions.
When radiation damage is uniform throughout a solar cell, the relative effectiveness of various energy particles is the same when measured by the diffusion length damage coefficients, or critical fluences determined by cell parameters such as Isc, Voc, or Pmax. In the case of protons with energies greater than 5 MeV, the damage to solar cells is relatively uniform. In this high energy range, the general concept of equivalency is directly applicable. At lower proton energies, the general concept of equivalency is not applicable; however, it can be used in a restricted manner as discussed below.
The degradation of n/p solar cells irradiated with protons of energies below 3 MeV is complex because of the nonuniform nature of the damage. Protons in the energy range from 1.5 to 3 MeV produce a maximum in relative radiation damage in silicon solar cells. The relative damage to silicon solar cell Voc and Pmax due to low energy protons is more severe than that exhibited by Isc.
Proton damage in silicon solar cells can be normalised to the damage produced by protons of one energy. The proton energy employed for normalisation of relative damage should be close to that producing maximum damage in space environments, produce relatively uniform damage, and be available for laboratory evaluations. The use of 10 MeV proton damage is based on a compromise of the above requirements. The results of several studies of proton damage have been summarised in terms of relative silicon solar cell damage as a function of proton energy. These relative damage results, normalised to 10 MeV proton damage, are shown in Fig. 5. The results in Fig. 5 have been shown to hold for both 10 ohm cm and 2 ohm cm solar cells at proton energies greater than 10 MeV.
![[Relative damage coefficients]](reldamcf.gif) |
| Figure 5. Relative damage coefficients for proton-irradiated n/p solar cells |
It is emphasized that the results in Fig. 5 are obtained by normal incidence laboratory irradiation of solar cells from the front side. If similar data were prepared for normal incidence rear irradiations, the result would be similar for proton energies above 10 MeV. For cells of 200 to 300 microns thickness, the effects due to rear incidence protons with energies below 10 MeV would be much lower than shown in Fig. 5. The lower effectiveness occurs because rear incident low energy protons have insufficient range in silicon to cause atomic displacements in the active region of the solar cell. However, 2 MeV protons have sufficient energy to reach the junction through 50 micron thick cells. Since the much higher values of the Voc and Pmax damage coefficients for low proton energies are due to the effects they produce near the junction, it should be pointed out that these higher values should only be used when the protons are incident on the front surface of the cells. When considering low energy protons incident on the rear cell surface, such as for the case of solar panels using lightweight substrates, only the Isc damage coefficients should be used.
The variation of solar cell output parameters with 10 MeV proton fluence is described by the equations for Isc, Voc, and Pmax in much the same way as is done for 1 MeV electrons. The values of the constants C, C', and C'' tend to be somewhat greater than those found for 1 MeV electron irradiation. These values determine the decrease in solar cell output parameter per decade of radiation fluence. The fact that these constants are somewhat different for electron and proton irradiation indicates that the concept of equivalency between the different types of radiation has limitations and is basically an approximation. This equivalence is further discussed below.
When the ATS-1 and Intelsat II-F4 satellites suddenly exhibited degradations in power output of the order of 20% in weeks to a month after launch, the importance of low energy proton damage was dramatically demonstrated. Subsequent efforts related this anomalous degradation to the bombardment of narrow exposed surface areas of the solar cells by the intense low energy proton fluence existing at geosynchronous altitude. The exposed areas resulted from slightly undersized or improperly applied coverglasses which exposed up to a 0.038 cm (15 mils) strip of solar cell surface. The high-intensity low energy proton fluence, though incapable of penetrating the solar cell to a depth of more than a few microns, was able to produce junction damage which would shunt the power-producing capability of the whole device. Exposed strips as narrow as 0.005 cm (2 mils) were sufficient to drastically alter the device's power-producing capability. The absence of this effect in earlier solar array systems was attributed to the use of a cell-shingling type panel construction and the presence of overlapping adhesive.
Low energy proton irradiation clearly has an inordinately greater effect upon solar cell Voc and Pmax as compared to similar irradiations with electrons or higher energy protons. Consequently, array manufacturers have taken measures to cover all areas of the silicon cell front surface with a coverglas and fill any gaps between the cell and coverglass with adhesive.
The changes caused by the irradiation of small unshielded areas of solar cells with low energy protons can be explained in terms of solar cell theory. It was previously mentioned that the range of low energy protons in silicon is limited to less than the cell thickness. Particles that do not penetrate the cell produce defects only to their depth of penetration. This limited penetration results in unusual effects in the case of protons because lower-energy protons produce more displacements per unit path length. The results of this behaviour are shown in Fig. 6. In this figure, the calculated number of displaced silicon atoms per unit proton path is plotted as a function of depth in silicon for a 3 MeV proton (range 92.7 microns). It can be seen that the damage rises rapidly to a maximum near the end of the proton track. Every proton which is stopped in the silicon produces such a damage peak at the end of its track. Protons which enter the silicon with energies of 0.5 MeV or less produce damage which is concentrated within a few microns of the cell surface. The space charge region of a modern cell extends from 0.4 to 1 micron below the cell surface. For this reason, low energy proton displacement damage is concentrated in the junction region.
![[Atomic displacements]](atomdisp.gif) |
| Figure 6. Atomic displacements as a function of depth for a 3 MeV proton in silicon |
The entire solar cell junction can be considered to be an array of small parallel diodes. Damage to only a small portion of this parallel diode array results in an increased effective leakage or saturation current for the entire array. The saturation current due to generation-recombination in the space charge region increases linearly as the carrier lifetime decreases (i.e. displacement damage increases) in the space charge region. The increased leakage current of a solar cell reduces the cell Voc because of the relationship of Voc and the junction leakage current. Since cell diode forward current is increased at all voltages, the current available to an external load decreases, and so Pmax will also decrease. Since solar cells are usually operated near the maximum power point, such changes have grave implications on in-flight performance.
The usage of body-mounted solar cells on spinning satellites provides a large measure of back shielding to a solar array. Oriented silicon solar panels with minimal back shielding can be degraded by low energy proton back side irradiation through carrier removal effects. The use of thin soldered back contacts or other minimal back shielding should greatly reduce these effects.
Of more practical importance is the fact that some ambient annealing of charged particle radiation damage exists. In the laboratory, the radiation exposure rate is usually many orders of magnitude greater than natural space radiation rates. In space, the damage and annealing processes occur simultaneously, with the annealing rate much closer to the damage rate than in the laboratory. For laboratory electron irradiation, ambient annealing as high as 10% in short circuit current has been observed in a few days to a month, predominantly in 10 ohm cm cells. For laboratory proton irradiation, ambient annealing of as high as 20% of short circuit current has been observed after 22 months.
The radiation effects observed in cover materials can be characterised as ionisation damage rather than displacement damage. In general, ionisation effects are usually dependent upon the absorbed dose and to that degree are independent of particle type or energy. Some exceptions to this rule occur in the case of highly charged massive particles. In such cases, the ionisation effects may be concentrated along the particle track rather than uniformly distributed. It is reasonable to assume that the ionisation damage produced in cover materials by space electrons and protons is related to the total absorbed dose. This assumption allows the various radiation components of the space environment to be reduced to a total dose, without a laborious detemrination of degradation constants for each energy and particle. It also allows the use of experimental data from a single ionising environment such as 1 MeV electrons.
The most significant radiation effects in cover materials involve changes in the transmission of light in the visible and near infrared region. These data can be reported by means of so-called 'wide-band' transmission loss. In this method, solar cell short circuit currents are measured under sun simulated conditions, with coverglasses attached. The coverglasses are attached with a thin liquid film with an index of refraction similar to that of silicone adhesive. The 'wide-band' transmittance is defined as the solar cell Isc with an irradiated coverglass in place divided by the solar cell Isc with the unirradiated coverglass in place. Such measurements are influenced by solar cell spectral response. Results determined with unirradiated solar cells will not be representative of those for irradiated solar cells. This error is probably negligible compared to the uncertainty of the available experimental data.
Since the 'wide-band' transmission loss is a measure of the loss light
transmitted, it directly affects the light generated current and likewise the
short circuit current. It is desirable to use the 'wide-band' transmission data
to estimate the change in solar cell Pmax. As seen
above, Pmax is proportional to
the product of Isc and Voc. Because
Voc is proportional to ln Isc, the
following relation can be developed to estimate the change in
Pmax due to coverglass darkening from transmission
data:
To aid in the estimation of solar array losses due to reduced transmission from radiation effects in coverglass materials, data relating transmittance to absorbed dose is required. In Fig. 7, 'wide-band' transmittance is shown for various absorbed doses. The absorbed doses were produced by 1 MeV electron irradiations in a room temperature, air environment which included no ultraviolet illumination. This electron radiation is sufficiently penetrating to produce a relatively uniform dose through the entire coverglass, coating, and filter. The Pmax/Pmax0 data shown in Fig. 7 were calculated from the 'wide-band' transmittance value by use of the equation above. The data include 0.0152 cm (0.006 in) 7940 fused silica and 0211 Microsheet coverglass with antireflecting coating and blue filter. It has been established that Corning 7940 fused silica exhibits little or no radiation darkening in the visible region. Since the transmission loss for 7940 coverglass must be assumed to be due to changes in the filter, the data can also be used for thicker coverglasses. For thicker 0211 Microsheet coverglass, the data in Fig. 7 cannot be used.
![[Variation of coverglass transmittance]](covglass.gif) |
| Figure 7. Variation of coverglass transmittance with absorbed dose |
![[Relative damage coefficients]](reldamse.gif) |
| Figure 8. Relative damage coefficients for space electron irradiation of shielded n/p silicon solar cells |
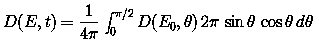
The equation for D(E,t) for the case
of electron space radiation can be modified as follows:
The evaluation of ionisation dose in solar array materials due to
omnidirectional space electron fluences is analogous to that just completed for
silicon solar cell degradation. In the case of absorbed dose, the energy
deposited by the radiation in the shielding is determined in terms of rads. To
evaluate this energy deposition at various depths in the shielding, an
expression similar to the equation for
D(E,t) can be used. This equation is modified to the
extent that the electron stopping power together with the flux-to-dose
conversion factor (see the dose equation above)
![[Absorbed dose]](absdosel.gif) |
| Figure 9. Absorbed dose per unit fluence of space electrons for various depths in planar fused silica shielding |
The data of Fig. 9 may be used to estimate the energy deposition in coverglasses and their subsequent darkening. The data must be used with caution and somewhat differently than the plotted solar cell damage coefficient data. For example, an omnidirectional fluence of 0.5 MeV electrons incident on 0.152 cm (0.06 in) thick coverglass material shows no energy deposition at a depth of 0.152 cm. This does not mean, however, that there is no energy deposition in this thick coverglass. Rather, there is a relatively constant energy deposition to a depth of approximately 0.0764 cm (0.030 in) in the glass and it will be darkened fully as much as though it were only 0.0764 cm thick. Thus, for irradiation by monoenergetic electrons, one has a coverglass which is either totally exposed or exposed to some depth relatively uniformly, and a corresponding transmission loss can be easily determined from existing experimental data. In an actual space application, however, the data in Fig. 9 has to be integrated with the expected electron fluence-energy spectrum to determine the actual dose-depth profile in the coverglass. For typical trapped eletron spectra, this integration will produce a dose-depth profile in which the absorbed dose decreases monotonically through the thickness of the coverglass. If this profile shows that sufficient exposure over a significant depth has occurred, an average energy deposition over that depth may also be estimated. This value may then be used in conjunction with the curves in Fig. 7 to estimate the transmission loss.
The physical distribution of low energy proton damage was discussed
above. The most significant aspect of the low energy
proton damage is the fact that most of the displacements are produced at the
end of the proton track, as illustrated in Fig. 6. The high damage
concentration near the end of the proton track allows the construction of a
simple damage model for the prediction of the effect of angle of incidence on
low energy proton damage in silicon solar cells. It is assumed that the effect
of a low energy proton, of arbitrary angle of incidence and energy, is roughly
equal to that of a normally incident proton with a range equal to the
perpendicular penetration of the non-normally incident proton. To partially
correct the inaccuracies of this proposed model, a factor is employed which
relates the ratio of the total displacements produced by the non-normally
incident proton to those of a normally incident proton which would penetrate to
the same depth in the cell. The total number of displacements may be computed
using the Kinchin and Pease [1955] model as discussed
above. The low energy proton relative damage coefficient
given by the above model can be expressed as follows:
When the range of a proton of energy E0 incident on a solar
cell at angle theta exceeds (cell thickness)/costheta, the proton
will penetrate the cell. This case is entirely analogous to the case previously
discussed for high energy electrons so that:
The first term in this equation represents the case when the proton completely penetrates the coverglass and the solar cell, while the second term applies when the proton penetrates the coverglass but stops in the cell. This integration has been done using the D(E0,0) values shown in Fig. 5. Separate integrations were done for D(E0,0) values based on Isc and on Voc, Pmax. D(E,t) Values calculated by the equation above unfortunately are a function of solar cell thickness. However, evaluation of this equation for cell thicknesses ranging from 0.0457 cm (0.018 in) to 0.005 cm (0.002 in) has shown that the dependence on cell thickness is very slight, and for practical purposes the results can be considered independent of cell thickness. The results of the numerical integrations for several coverglass thicknesses are shown in Figs. 10 and 11.
![[Relative damage coefficients]](reldamp1.gif) |
| Figure 10. Relative damage coefficients for space proton irradiation of shielded n/p silicon solar cells (based on Isc) |
![[Relative damage coefficients]](reldamp2.gif) |
| Figure 11. Relative damage coefficients for space proton irradiation of shielded n/p silicon solar cells (based on Pmax or Voc) |
The values of relative damage constants for omnidirectional fluences of protons on shielded solar cells allow a space proton environment to be reduced to an equivalent fluence of normally incident 10 MeV protons on unshielded silicon solar cells. Experimental studies of silicon solar cells have indicated that a fluence of normally incident 10 MeV protons produces damage that can be approximated by a fluence of 1 MeV electrons, which is 3000 times that of the 10 MeV proton fluence.
The evaluation of the absorbed dose in shielding materials due to space protons requires an analysis similar to that for space electrons. For this evaluation an expression similar to the equation for D(E,t) is used. The quantity D(E0,0) is replaced by the stopping power times the flux-to-dose conversion factor for protons of energy E0, and the quantity D(E,t) becomes the absorbed dose per incident omnidirectional flux proton of energy E at shielding depth t. The results of this integration for several shielding thicknesses of fused quartz are shown in Fig. 12. The same cautions discussed above regarding the use of electron dose calculations also apply here.
![[Absorbed dose]](absdospr.gif) |
| Figure 12. Absorbed dose per unit fluence of space protons for various depths in planar fused silica shielding |
The three basic input elements necessary to perform degradation calculations are:
This equation can also be used for space protons with the exception that
D(E,t) values for protons are based on 10 MeV proton
fluences rather than 1 MeV electrons. The calculated equivalent fluence will
therefore be a damage equivalent 10 MeV proton fluence. The equivalent 10 MeV
proton fluence can be converted to equivalent 1 MeV electron fluence as
follows:
An additional problem arises in calculating equivalent fluences for proton environments. The results shown in Figs. 10 and 11 reveal that different values of D(E,t) for proton irradiation are found when this damage constant is based on cell Isc or Pmax and Voc. The Pmax, Voc damage coefficients are higher in the low energy region, which accounts for the much higher damage produced in these parameters by low energy protons. This differs from the results of electron irradiation where one value of D(E,t) describes the behaviour of all cell output parameters. Because of the two sets of D(E,t) values for proton irradiation, two different equivalent 10 MeV proton fluences must be considered: one will describe the variation of solar cell Pmax and Voc, the other the variation of Isc.
The values of D(E,t) have been calculated assuming infinite back shielding. Although this condition is often approached by the body-mounted solar arrays of spinning spacecraft, it is not generally true. The designer must also evaluate the contribution of equivalent fluence resulting from radiation incident on the back side of the solar cells. The result is a front and a back component of equivalent fluence. A question arises as to the values of D(E,t) to be used for back irradiations. In the case of trapped space electron irradiation, it is reasonable to use the same values of D(E,t) for both front and back irradiations. The only problem in this case is to convert the backshielding of the panels, satellite, etc., to an equivalent planar shielding.
The case for space protons is considerably more compelex because of the non-penetrating nature of low energy protons. Low-energy proton irradiation from the rear not only increases bulk resistivity, thereby decreasing the fill factor, but also greatly changes the forward dark I-V characteristic curves. These phenomena, peculiar to rear irradiation, must be considered and included in the evaluation of D(E,t). In case D(E,t) cannot be properly evaluated, the only alternative is to use the front irradiation data, assuming that both front and back irradiations produce the same results as long as all protons penetrate through the junction. However, the use of the Pmax, Voc coefficients, which were designed to account for the high junction damage by low energy protons, is not considered proper for protons incident on the rear cell surface. Therefore, only the Isc proton damage coefficients are used for rear incidence protons. To allow for the self-shielding effect for cells irradiated with protons from the rear, the back contact solder thickness (approximately 0.01 to 0.08 mm) plus the thickness of the substrate and the substrate adhesive should be included in the total back shielding.
The absorbed dose must be calculated at several depths in the cover material, and the electron and proton portions of the environment must be summed to determine the dose-depth profile. The necessity of including contributions from back radiations must also be considered. In practice, the dose deposited will decrease greatly with increasing depth into the cover materials. The greater dose near the surface is due largely to low energy trapped protons, and contributes little to the average dose deposited in the cover materials. Because of the uncertainties in evaluating cover materials transmission loss in space, there is little to be gained in making an extremely accurate evaluation of the surface dose. When the average dose deposited in the cover material is known, the degradation in transmission can be estimated from data such as those presented above. These loss factors may then be applied to the estimated solar cell output parameter values.
The damage produced by back radiation is, to first order, regarded as the same in nature and magnitude as that produced by the front radiation provided only Isc damage coefficients are used. An equivalent fluence attributable to the back radiation can be added to the front contribution by estimating an effective thickness of back shielding. This assumption is not valid when higher order effects are considered. If a composite backshielding material is similar to the coverglass, only a density correction is required to compute the effective shielding thickness. This is done by comparing shield thicknesses in units of g cm-2. If the atomic number and/or density of the substrate is vastly different from that of glass, the equivalent fluence should be computed using effective damage coefficients specifically developed for the new shielding material. However, the uncertainty contributed by an improper Z correction is probably much less than the uncertainty introduced by applying these damage coefficients to rear incidence calculations.
The process of calculating an equivalent 1 MeV electron fluence reduces the space radiation environment to a laboratory electron environment for which solar cell degradation has been evaluated. When the damage equivalent fluence is known, the estimation of solar array degradation is almost completed. The next step in estimating array degradation is to make use of such variables as base resistivity, cell thickness, front surface treatment (such as AR coating and texturing), and rear surface treatment (such as back surface fields and back surface reflectors) to choose proper solar cell radiation data. The equivalent fluence then allows the estimation of solar cell output parameters through the use of the appropriate data.
Berger and Seltzer, NASA SP-3036, 1966.
Brown, W. L., J. D. Gabbe, and W. Rosenzweig, Results of the Telstar Radiation Experiments, Bell System Technical J., 42, 1505, 1963.
Janni, AFWL-TR-65-150, 1966.
Kinchin, G. W., and R. S. Pease, The Displacement of Atoms in Solids by Radiation, Report Prog. Phys., 18, 1, 1955.
Marvin, D. C., Assessment of Multijunction Solar Cell Performance in Radiation Environments, Aerospace Report No. TOR-2000(1210)-1, 2000.
Marvin, D. C., and J. C. Nocerino, Degradation Predictions for Multijunction Solar Cells on Earth-Orbiting Spacecraft, Aerospace Report No. TOR-2000(1210)-2, 2000.
Seitz, F., and J. S. Koehler, Displacement of Atoms During Irradiation, Solid State Physics, 2, 305, 1956.
Tada, H. Y., A Theoretical Model for Low-Energy Proton Irradiated Silicon Solar Cells, in Proceedings of the 5th Photovoltaic Specialists Conf., Vol. II, D-8-1, 1966.
Tada, H. Y., Equivalent Fluence and Relative Damage Coefficient - Tools For Space Solar Cell Degradation Estimate, IEEE Trans. Nuc. Sci., NS-20, 6, 234, 1973a.
Tada, H. Y., A New Dimension in Solar Cell Degradation Estimate In-Space RDC Matrix Method, Conf. Rec. of the 10th IEEE Photovoltaic Specialists Conf., 392, 1973b.
Tada, H. Y., J. R. Carter, Jr., B. E. Anspaugh, and R. G. Downing, Solar Cell Radiation Handbook, Third Edition, JPL Publication 82-69, 1982.
Last update: Mon, 12 Mar 2018